
By Robert Carpenter
Having recently switched to new measurement microphones with an advertised voltage range from 12V-48V for their power requirements, and being in possession of a Lectrosonics wireless receiver and plug-on transmitter, I decided to explore what would differ, if anything, at the different voltage settings available to me.
I decided there were two factors here I could test, the sensitivity at each voltage, and the frequency response. For both sets of data, I tested wireless at 48, 15, and 5 volts of phantom power, and wired with (48V) phantom from my interface. For the sensitivity test I captured spectrum measurements of the microphone fitting with my calibrator in each configuration. For the frequency response, I captured transfer function measurements in each configuration with pink noise as the test signal.
The Rig
Before we look at the data, it seems worthwhile to discuss the equipment and the setup. All measurements were taken with an iSEMcon EMX-7150 measurement microphone, feeding into an Audient EVO 8 interface. The same input was used for all measurements, and no adjustments were made to the gain during the testing. It was set to 29 from within Smaart Suite (the 9.2.9050 beta build), resulting in a level of -20dBFS when receiving signal from the iSEMcon SC-1 calibrator set to 94dB. Wireless measurements were performed using a Lectrosonics DPR plug-on transmitter, and a DCR822 receiver. Gain on the transmitter and receiver was set to preserve the same -20dbFS signal level from the calibrator at the transmitter, the receiver, and the interface at the 48V phantom power setting. This resulted in a gain of 20 on the DPR, and an Audio Level of -20 on the DCR. Roll off was set at 25Hz on the DPR for measurements.
Spectrum Response
Those playing along at home may note that by setting the Lectro side of the chain to mimic the signal levels of the wired option we’ve essentially fixed the 1KHz point of the spectrum at a known level for both the 48V wired and wireless options. So, what are we actually looking at then? Well, a few things. Firstly, at what levels do we even get meaningful data? 5V doesn’t provide enough power to get any useful information from the microphone. 15V does, and we actually get the same peak level at our 1K calibration point as we do with 48V of phantom power.
The other thing to notice is that the teal trace, the analog measurement, has a notably lower noise floor than the wireless measurements, but that the two wireless measurements track each other well enough that the differences are going to come down to randomness in noise floor. In actual measurement scenarios that level of noise isn’t going to be an issue, as we’ll see shortly. It is well below the signal level, enough so that we can reasonably expect it to be non-interacting.
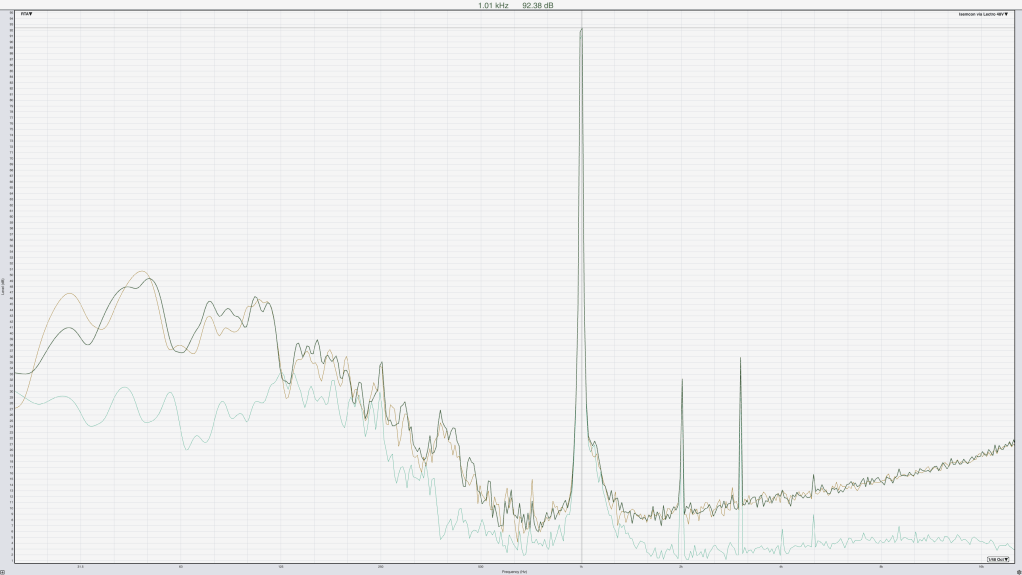
Traces shown are the Analog baseline in Teal, the 48V Lectro in the foreground in dark green, and the 15V Lectro in brown. Grid spacing is 1dB vertical spacing, and the calibrated level is being plotted here as evidenced by the range from 1 to 95 being shown. The analog level is about 1dB below the two wireless measurements at the 1K point here, so the settings on the Lectro didn’t perfectly reflect the level of our copper cable, but we got close enough for the purposes of our data.
Frequency Response
It’s all well and good to look at the spectrum and say that we’re matching at a specific frequency, but that doesn’t really tell us about how the microphone would perform at actual measurement tasks, just that we will get the same level regardless of our voltage (provided we give it enough voltage to work at all). For that we want to look at the full range of our spectrum. Well, the system on my desk sadly doesn’t go down to 20Hz, but I think 60Hz will be close enough for today.
Pink noise was used because I just love the sound, but more importantly/seriously because it meant I could get the results I needed quickly by virtue of having all frequencies represented in a short amount of time. The microphone was setup about 1.5 feet (0.46m for those more used to thinking in better units) from the speaker, not ideal for making meaningful tuning decisions, but perfectly suitable for comparing our 3 options. The position wasn’t super precise, as can be seen from the variance in the high frequencies of the phase response, but the phase differences there amount to about 0.14” (or 0.35cm) so I’m fairly happy with how well I did.
The delay shown for the wireless measurements was 1.29ms for the wired and 2.85ms for the wireless measurements. A measurement was also taken, and is included with the data attached, of the analog at the same delay as the wireless for those interested, it shows the same trends as the other traces, but with a phase trace that obscures some data, fun! Since in a real measurement scenario you would be timing things correctly for the data you’re hoping to collect, that’s what we did here.

What we see from our traces, conveniently colored the same as the spectrum graph above, is that the frequency response of our microphone remains very consistent regardless of connection method or phantom power voltage. We can additionally see that the wireless isn’t making a meaningful difference to the phase response of our data either, which is good since it means we can mix and match wired and wireless microphones in the same session and trust that our data from each is comparable.
Conclusions
So, what have we learned? Well, what we’ve learned is that we can set the Lectrosonics transmit/receive pair up to act as pretty close to a copper cable, meaning as long as we turn phantom power off on the interface when using it, our measurements will be essentially interchangeable, and our SPL values will even remain accurate for monitoring or tuning purposes. We also showed that if we’re measuring at anything close to operational levels the difference in noise floor isn’t going to make a meaningful impact to our measurement, if it was, we’d have seen that in the Transfer plot which was taken well below concert levels. The important take away for me was that I can operate my Lectro using 15V for phantom instead of 48V, and hopefully cut down on my battery consumption in the process.
Appendix
That’s right, I’ve got more for you. If you know me, you know I’m a big fan of collecting a ton of data, so I’ve also got some data for what the different roll off options for the Lectro DPR do to the signal. These measurements were entirely electronic, no microphone involved; just a cable out of the interface into the DPR, wireless to the DCR, and wired back into the interface.

In this graph the foreground brown trace is the 25Hz roll off, dark green is 35Hz, red is 50Hz, and blue is the default 70Hz. I didn’t measure any of the higher settings in my testing, because I like to be able to measure subwoofers and 70Hz was the default setting.
Below are all the traces shown/discussed here, so you can replicate the graphs yourself.
